We understand PSI and CFM measure different, but essential, aspects of an air compressor: PSI gauges the potential energy per unit area, shaping resistance and pressure head; CFM tracks the air volume delivered per minute, reflecting demand capability. In practice, we balance both to match load profiles, duty cycle, hoses, and valves. If you want reliable performance, you’ll need to see how a unit’s curve covers your tools’ needs and where myths about a single number fail—and that leads to a practical selection path.
Key Takeaways
- PSI measures potential energy per unit area, indicating system pressure; CFM measures the volume of air moved per minute, indicating flow rate.
- PSI governs resistance and pressure head; CFM shows the compressor’s ability to sustain air delivery under load.
- The delivered CFM depends on compressor design, piping losses, valves, and duty cycle, not on PSI alone.
- Matching tools requires aligning target PSI and CFM with duty cycle, tool type, and workload for reliable performance.
- Performance curves and real-world testing help identify stable operating points, efficiency, and noise/quality indicators for PSI-CFM behavior.
What PSI and CFM Actually Measure
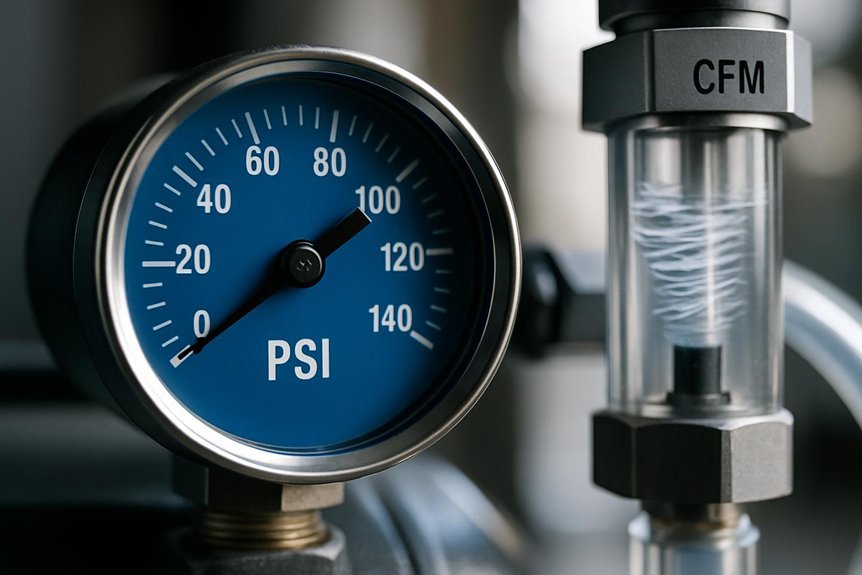
PSI and CFM are fundamental measurements for air compressors, but they quantify different aspects of performance. We measure pressure in PSI to indicate potential energy available at a point in the system, and we measure flow in CFM to indicate volume moved per minute. In practice, PSI governs resistance to flow, while CFM reflects the system’s ability to sustain demand. Misconceptions arise when readers assume a single value defines capability; actual performance depends on pressure drop, vessel volume, and outlet conditions. Gauge calibration determines accuracy of the readings we rely on, so we must routinely verify regulators, gauges, and sensors. Understanding that PSI is a pressure metric and CFM a flow metric helps us select components that match required duty cycles and tools.
How PSI and CFM Work Together in Practice
We’ll examine how PSI and CFM jointly shape tool performance by linking pressure to flow in real loads. When pressure holds, higher CFM sustains tool endurance; when CFM drops, PSI must compensate to keep output steady. This practical interplay guides selection and runtime estimates for real-world tasks.
PSI And CFM Interplay
Ever wonder how pressure and volume cooperate in an air system? We study PSI and CFM as interdependent parameters that define usable air. Increasing PSI raises potential energy per unit area, but delivered CFM depends on compressor design, valve sizing, and piping losses. In practice, duty cycles shape runtime: higher PSI often reduces achievable CFM at load due to compressor displacement limits, while larger CFM at lower PSI may sustain tools with steadier airflow. Our goal is to match target pressure with required delivery, avoiding overpressurization that wastes energy. Two two-word ideas anchor assessment: efficiency tradeoffs and noise considerations. We quantify performance with pressure drop, compressor efficiency curves, and instantaneous flow at operating points, ensuring the system maintains steady flow without excessive cycling or leakage.
Practical Pressure-Flows Dynamics
In practice, pressure and flow move together through a system: we target a usable PSI at the tool while ensuring enough CFM to sustain that load without oscillations. We map relationships with concrete targets, not vibes, so performance remains predictable.
- Idle airflow vs. loaded flow: we compare regulator yaw effects on downstream stability.
- Pressure headroom: we quantify how small PSI shifts impact CFM delivery and tool response.
- System impedance: we assess hose diameter, fittings, and valve behavior to limit oscillations.
We measure with steady-state tests, capturing PSI-CFM pairs and noting how idle airflow sets baseline for dynamic response. This framework keeps our expectations aligned, avoiding overmentality. Practically, the aim is stable pressure, sufficient CFM, and minimized regulator yaw under real work loads.
Performance For Tools Endurance
We start with a direct look at how PSI and CFM sustain tool endurance under real workloads: stable delivery matters more than peak numbers. We analyze performance endurance by pairing constant CFM with appropriate PSI to maintain uninterrupted flow at load. Tools draw surge current during fast runs; a compressor must supply steady air volume without pressure dips that stall actions. Quantitatively, endurance improves when CFM exceeds peak tool demand by a safe margin, while PSI is kept within manufacturer-recommended bands to prevent component fatigue. Tool compatibility hinges on matching duty cycle, nozzle size, and regulator accuracy to expectable workloads. In practice, we measure runtime stability, cycle consistency, and recovery time, then translate those metrics into dependable performance endurance rather than transient spike performance.
How to Read a Compressor’s Performance Curve
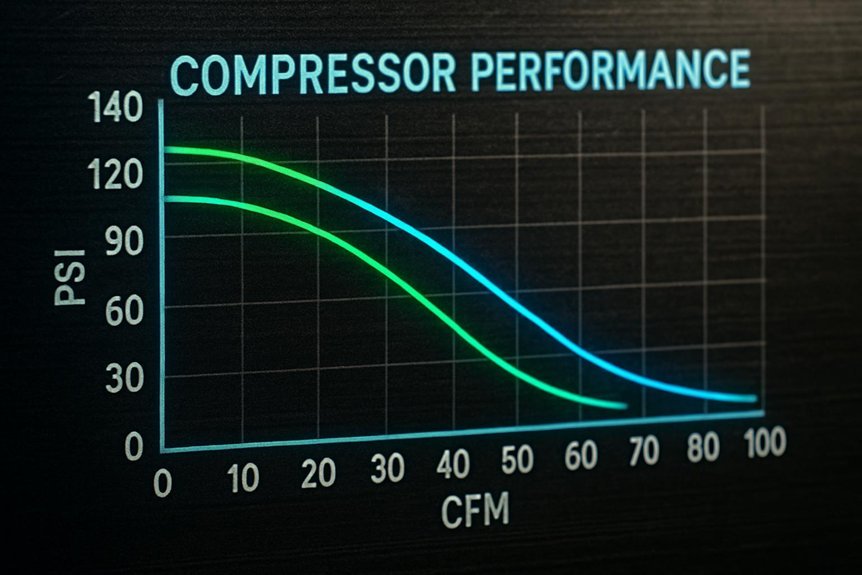
A compressor’s performance curve translates the device’s capacity and pressure across different operating speeds, temperatures, and intake conditions into a single, interpretable graph. We read it by tracking how CFM and PSI shift with speed, observing the headroom at each operating point, and identifying optimal ranges for sustained use. This lets us quantify efficiency, reserve capacity, and response times.
- Identify operating point: locate target CFM and PSI, verify tolerance bands.
- Compare curves: assess deviation under temperature or intake changes, noting stability.
- Extrapolate limits: determine shutoff pressures, surge regions, and safe duty cycle.
two word discussion ideas, irrelevant subtopic
Matching PSI/CFM to Common Tools
Matching PSI/CFM to Common Tools requires selecting pressure and flow ranges that align with each tool’s design. We evaluate tools by intended duty cycle, nozzle size, and required outlet pressure, then map these needs to compressor capabilities. For impact wrenches and grinders, we target 90–120 psi and 4–6 CFM, ensuring peak demands stay within 10–20% headroom to prevent droop. Spray tools demand steady, lower variance, so we choose 40–60 psi with 4–5 CFM, prioritizing consistency over brute flow. Drills and nailers benefit from mid-range PSI (60–90) with 2–3 CFM, avoiding overheating and pulsation. Our approach prioritizes high efficiency through throttle control and receiver sizing, while noise minimization informs adoption of lower-duty-cycle settings and vibration isolation. In each case, alignment reduces waste, prolongs tool life, and enhances performance.
Practical Steps to Choose the Right Compressor
What steps should you take to pick the right compressor, quickly and accurately? We approach selection with data-driven checks and clear constraints. We quantify load, duty cycle, and peak demand, then map to CFM/PSI targets and tank size. We examine running costs, noise impact, and space limits, prioritizing reliability and predictable maintenance cadence. We balance initial cost against long-term efficiency, factoring compressor type (piston vs rotary) and cooling needs. We assess overheating concerns, filtration quality, and serviceability to minimize downtime.
1) Define load profile: continuous vs intermittent, worst-case CFM/PSI.
2) Match components: motor power, tank capacity, and duty cycle to use case.
3) Plan maintenance and cooling: routine checks, overheating mitigation, and parts availability.
Common Myths and Pitfalls to Avoid
Are we overlooking hidden pitfalls that derail PSI vs CFM decisions? We analyze performance demand, not just labels, by matching target CFM at expected duty cycles to compressor duty and tank storage. Common myth debunking begins with “bigger is always better”—not true in continuous runs or portable use, where oversizing raises cost and lag constraints. Pitfall avoidance requires quantifying pressure drops, line impedance, and regulator response time, then validating with real load profiles. Misinterpreting PSI ratings or assuming peak values without duty-cycle context leads to incorrect choices. We emphasize steady-state efficiency, CFM at operating PSI, and tank fill versus cycle rate. Clear specifications, reproducible tests, and documented tolerances reduce decision noise and align equipment with actual work, not marketing claims.
Quick Checklist for Buyer Confidence
We start with clear Power Output Metrics and robust Build Quality Indicators to ground your choice. We’ll compare rated vs. actual performance, duty cycle, and noise levels, tying each metric to expected outcomes. Our practical checklist focuses on measurable specs, reproducible results, and durable construction to boost confidence before you buy.
Power Output Metrics
When evaluating power output, a quick checklist keeps buyers confident in performance claims. We align metrics with practical use, focusing on repeatable numbers and real-world behavior.
1) Power output versus rated duty cycle: verify continuous versus peak performance under load to avoid overruns.
2) Noise levels and acoustic profile: compare dB at typical operating distances to gauge workplace impact.
3) Efficiency of air delivery: examine CFM at varying pressures to ensure tool compatibility and minimize fluctuations.
These data points establish a precise performance picture, guiding selection beyond marketing figures. We prioritize repeatable measurements, document test conditions, and flag anomalies. By anchoring decisions to concrete numbers rather than impressions, we reduce guesswork and support informed buying. Power output clarity, coupled with predictable noise levels, enhances reliability assessments and aligns expectations with daily operation realities.
Build Quality Indicators
What signals build quality most reliably? We assess outlets, chassis, and components with a quantitative lens. Our quick checklist emphasizes rugged construction, consistent finish, and secure hardware—each metric correlating with longevity and repeatable performance. We measure tolerance stacks in critical assemblies, verify fittings for axial play, and confirm vibration isolation reduces dynamic stress. We track noise level as an indirect quality proxy: lower, stable sound profiles indicate tighter assemblies and better alignment. Pressure gauges, regulators, and relief valves should read and respond with minimal hysteresis. Electrical insulation, cord integrity, and switch ramp behavior reveal attention to safety and durability. In aggregate, stronger build quality yields steadier runtime, fewer leaks, and predictable maintenance windows, all crucial for trusted PSI versus CFM performance comparisons.
Frequently Asked Questions
How Does Duty Cycle Impact Continuous Tool Use?
We answer: duty cycle limits continuous use by dictating on/off time; sustained tool operation exceeds capacity causes overheating or pressure drop. We, together, monitor duty cycle to maintain reliable continuous use and prevent performance loss.
Can PSI Exceed CFM Ratings for Short Bursts?
We can’t rely on high PSI beyond CFM ratings long-term; bursts may spike locally but pressure drops fast. PSI vs CFM differences matter: maintain rated CFM at target PSI, avoid overstress, and monitor regulator accuracy for precise tool performance.
Do Air Receivers Affect Actual CFM Delivery?
With an allusion to a quiet tidal surge, we answer: yes, air receivers influence actual CFM by smoothing demand and extending duty cycle. We monitor pressure, volume, and flow to optimize the air receiver’s duty cycle.
How Do Compressor Unload/Reload Cycles Influence Performance?
Unload cycles reduce average delivery pressure while reload cycles restore it, directly impacting flow stability and energy use. We, reader, quantify that cycle duty, duty cycle, and reservoir sizing to optimize unload/reload timing for consistent performance.
Are There Industry Standards for Psi/Cfm Labeling?
We’ll admit it: there are industry standards for labeling psi and cfm, though limits compliance and maintenance labeling often differ by sector. We quantify requirements, align with specs, and guarantee our labeling supports practical, precise maintenance.
Conclusion
We’ve shown that PSI and CFM aren’t interchangeable; they’re engine and fuel for your tools. A practical rule: if your peak demand is 10 CFM at 90 PSI, you’ll want a compressor that can sustain around 10 CFM at or above 90 PSI, with margins for hoses and fittings. A striking stat: even a 20% dip in delivery under load can double tool stall risk. Prioritize a curve that maintains CFM as pressure rises to meet real-world duty cycles.

